Hourly Reporting
M-RETS supports Hourly Reporting for single and multiple vintages. M-RETS offers the ability to view a report that displays how hourly data can be used by your organization.
Notes regarding hourly claims and reporting: M-RETS allows Hourly Reporting only for intact (i.e. not subdivided after issuance) batches of Certificates. The following will render a batch of certificates ineligible for Hourly Reporting at this time:
- Certificates that an Organization separated into multiple active batches for any reason, even if they maintain ownership of all the RECs from the original issuance.
- Certificates in a batch where RECs from the issuance batch were transferred to another party.
- Certificates where any of the RECs from the batch as issued were retired.
### 2. The table displays all eligible hourly data. Certificate batches must be intact, or they will not be displayed here. Select the certificate batches for which you would like to run the report. If you select the same month from more than one generator, the resulting report will show a combined hourly value for all selected generators. 
### 3. Input the preferred format for your report: See below for a defintion of each option. #### Operation Type 1. Aggregate: The sum of kWh, per hour of the day. 2. Average: The average of kWh, per hour of the day. 3. Min: The lowest generation of kWh, per hour of the day. 4. Max: The highest generation of kWh, per hour of the day. #### Time Unit 1. By hour and day: This report displays Hourly Data on a table displaying 24-hour (X-axis) by the dates of the month (Y-axis). 2. By hour: This report displays Hourly Data on a table displaying 24-hour (X-axis). Only the selected criteria above is shown on this table. This report has no Y-axis. 3. By hour and day of week: This report displays Hourly Data on a table displaying 24-hour (X-axis) by the days of the week (Y-axis). #### Time Zone Choose your preferred time zone. You can also adjust this filter after running the report. Select 'Next' 
### 4. This page displays your hourly data. As a reminder, only one number will be shown if you select the same month from multiple Generators.  ### 6. M-RETS offers two displays of your data: "Visualization" and "Data". "Visualization" will show a line graph of hourly data, and "Data" is the raw data per hour.  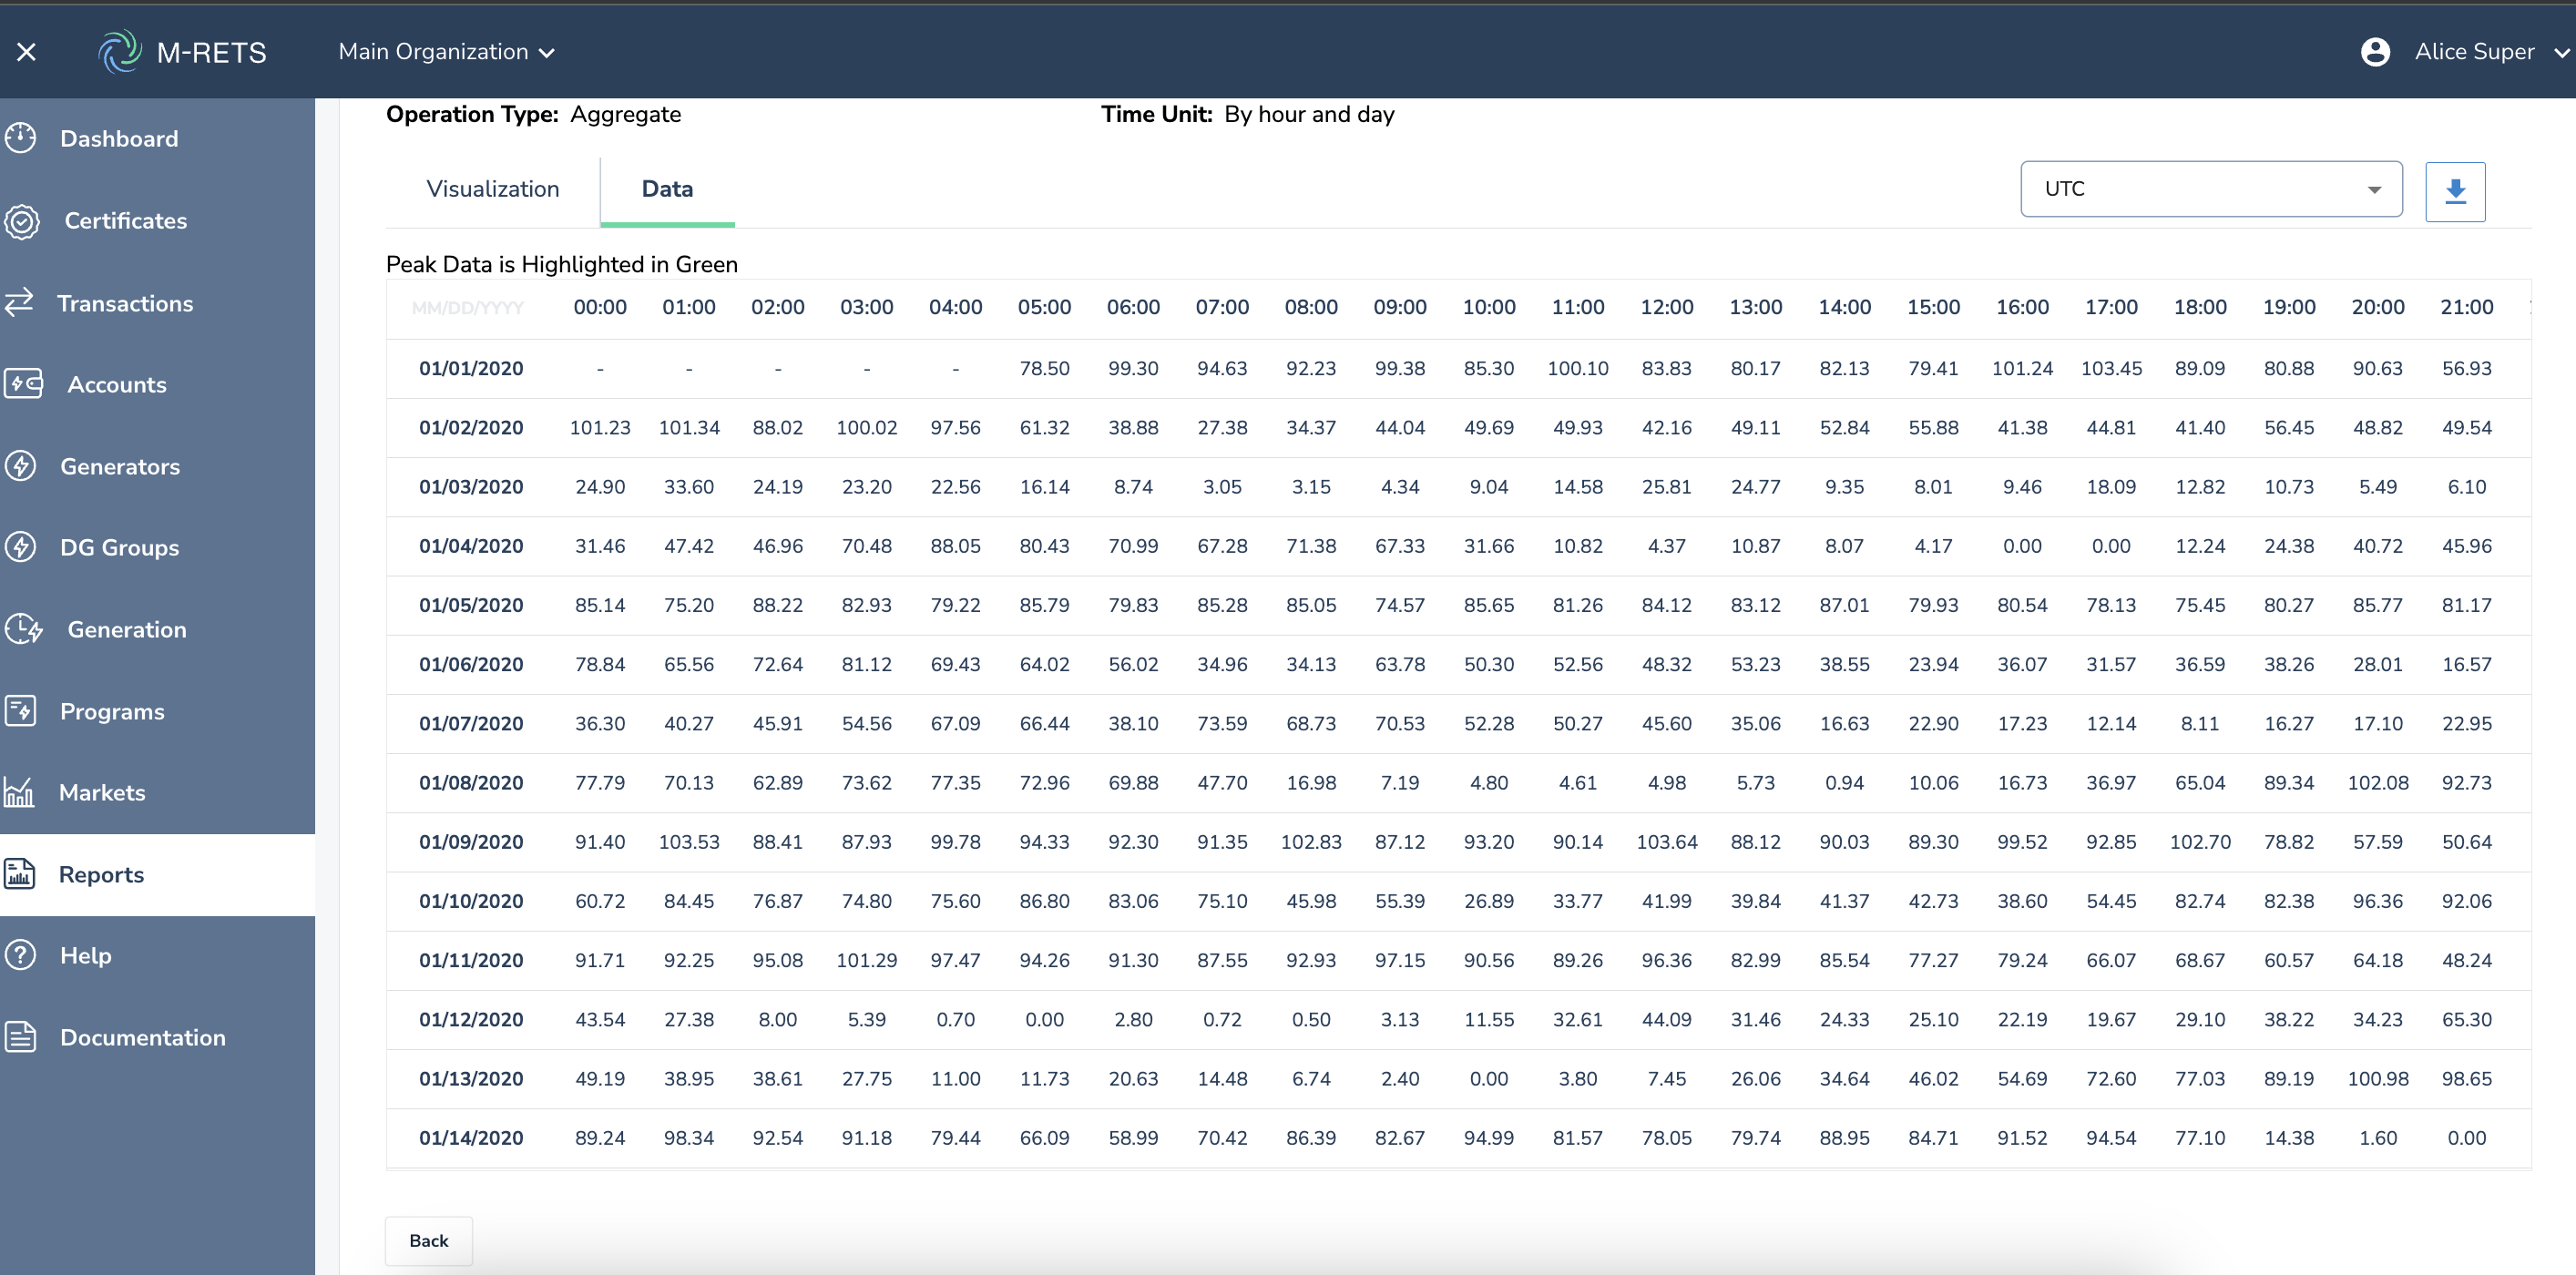
### 7. You can change time zones by selecting the drop-down in the top right corner of the report.

# Troubleshooting ### Why is some of my hourly data missing? You may see a value of '-' depending on your selected time zone. This value fills in gaps between the issuance time zone and the reporting time zone. For example, Generator A issued 10 kW at 01:00 **Pacific Time**. On the report in **Central Time**, that 10 kW generation will show at 03:00. M-RETS defaults to Coordinated Universal Time(UTC) 
### Why is only one number displayed for multiple generators? Currently, M-RETS only supports a report that displays a reading of one number per hour, per day/date. This is regardless of how many Generators are selected. If three generators with vintages of March 2023 are selected the report will display the combined total of all reported generation for any given hour. [Back](https://mrets.github.io/Help/index)